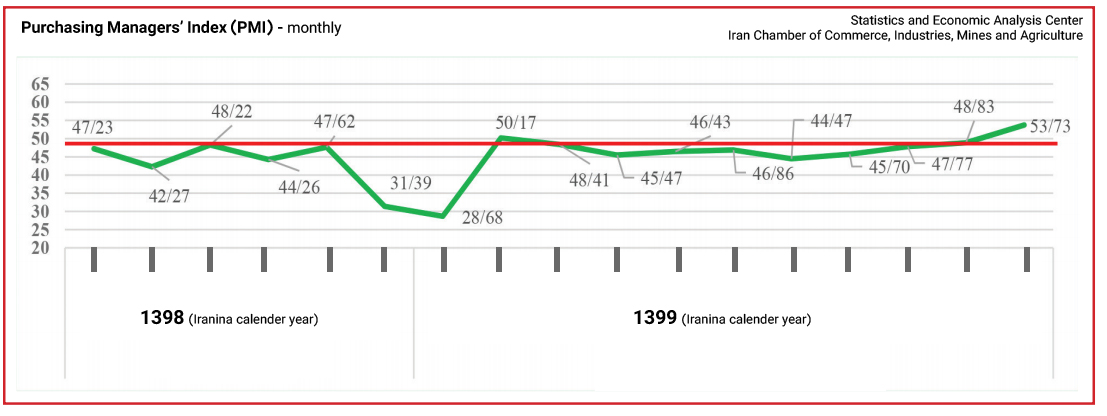
The overall Purchasing Managers’ Index, known by its Farsi acronym Shamekh, for Iran’s economy settled at 53.73 in the month ending Feb. 18 from 48.83 in the month ending Jan. 19, indicating 4.9 points or 10.03% improvement.
A report by the Statistics and Economic Analysis Center of the Iran Chamber of Commerce, Industries, Mines and Agriculture, the coordinator of the survey shows the index hit a 16-month high (since the beginning of PMI reporting).
The headline PMI is a number from 0 to 100, such that over 50 shows an expansion of the economy when compared with the previous month. A PMI reading under 50 indicates contraction and a reading of 50 implies no change.
PMI is an index of the prevailing direction of economic trends, aiming to provide information about business conditions to company directors, analysts and purchasing managers.
According to the report, the “business output” sub-index increased from 46.75 in the ninth month (Nov. 21-Dec. 20, 2020) to 50.01 in the 10th month (Dec. 21, 2020-Jan. 19) to 56.71 in the 11th month of the current Iranian year (Jan. 20-Feb. 18).
The “new orders” sub-index dropped from 44.11 in the ninth month to 43.99 in the 10th month, but rebounded to 53.43 in the 11th month.
The “supplier deliveries” sub-index, which measures how fast deliveries are made, increased from 53.20 in the month ending Dec. 20 to 57.11 in the month ending Jan. 19 to 57.99 in the month ending Feb. 18.
The “raw materials inventory” sub-index climbed from 46.13 in the month ending Dec. 20 to 49.47 in the month ending Jan. 19, but slid to 48.26 in the month ending Feb. 18.
The PMI reading of “employment” sub-index fell from 51.30 in the month ending Dec. 20 to 48.09 in the month ending Jan. 19, but rose to 49.99 in the month ending Feb. 18.
To calculate PMI, seven secondary criteria were also surveyed by the center, namely “raw material purchase prices”, “warehouse inventory”, “exports”, “product price”, “fuel consumption”, “sales” and “production expectations”.
The “raw material purchase prices” sub-index decreased from 76.64 in the month ending Dec. 20 to 72.76 in the month ending Jan. 19, but increased to 79.72 in the month ending Feb. 18.
The “warehouse inventory” sub-index slid from 49.84 in the month ending Dec. 20 to 48.85 in the month ending Jan. 19, but climbed to 49.29 in the month ending Feb. 18.
The “exports” sub-index dropped from 46.14 in the ninth month to 43.46 in the 10th month, but jumped to 47.56 in the 11th month.
The “prices of manufactured products or services” sub-index decreased from 56.73 in the month ending Dec. 20 to 56.34 in the month ending Jan. 19, but increased to 58.12 in the month ending Feb. 18.
The “fuel consumption” sub-index fell from 60.44 in the month ending Dec. 20 to 57.65 in the month ending Jan. 19 to 54.72 in the month ending Feb. 18.
The “sales” sub-index improved from 42.19 in the month ending Dec. 20 to 47.86 in the month leading to Jan. 19 to 53.72 in the month ending Feb. 18.
The sub-index entitled “business output forecasts for the following month” climbed from 56.38 in the month ending Dec. 20 to 60.95 in the month ending Jan. 19, but dropped to 58.92 in the month ending Feb. 18.
The overall PMI grew from 47.77 in the month ending Dec. 20 to 48.83 in the month ending Jan. 19 to 53.73 in the month ending Feb. 18.
PMI, among the most precise indicators showcasing a country’s economic condition, was first devised by the Institute for Supply Management in the United States in 1948. It is calculated as (P1 * 1) + (P2 * 0.5) + (P3 * 0) where P1 is the percentage of answers reporting an improvement, P2 is percentage of answers reporting no change and P3 is percentage of answers reporting a deterioration.