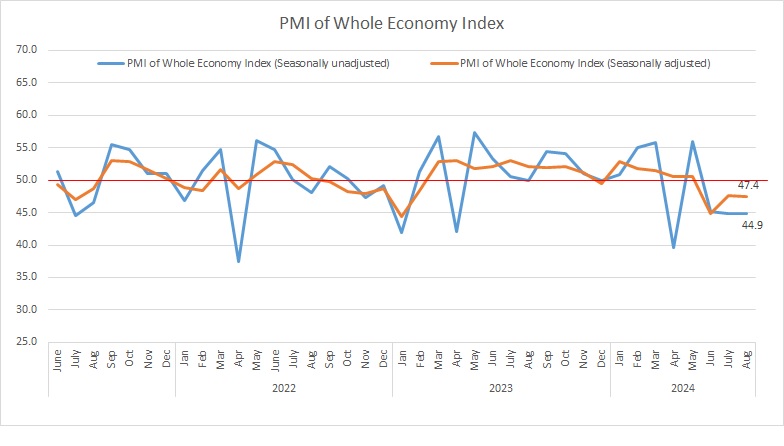
Iran Chamber of Commerce, Industries, Mines, and Agriculture (ICCIMA) has released the country’s new PMI data for the fiscal month of Mordad (July 20 – August 21, 2024) which is below the threshold for a fourth consecutive month.
The seasonally adjusted PMI was reported at 47.4, signaling a decrease in the Iranian economic activities although the drop has taken place less sharply than the preceding month when the PMI reading was reported at 47.2. The figure stood at 44.9 before the application of seasonal adjustment.
Seasonal adjustment, or deseasonalization, is a statistical method used to remove the seasonal component from a time series, allowing for the independent analysis of trends and cyclical deviations. After preparing dozens of PMI (Purchasing Managers' Index) reports, the Research Center of Iran Chamber of Commerce, Industries, Mines, and Agriculture has now identified the seasonal components of these time series and prioritized seasonal adjustment in its monthly PMI reports.
The decline in the index has been attributed to summer holidays and electricity outages which happen amid unprecedented heat.
The report also signals that failing to allocate enough currency resources to raw materials keeps the production units to work at levels under their potentials.
The Statistics and Economic Analysis Center of Iran Chamber of Commerce, Industries, Mines and Agriculture, the sponsor and coordinator of the survey, announces the whole economy PMI data in a report every month.
The headline PMI is a number from 0 to 100, such that over 50 shows an expansion of the economy when compared with the previous month. A PMI reading under 50 indicates contraction and a reading of 50 implies no change.
PMI is an index of the prevailing direction of economic trends, aiming to provide information about business conditions to company directors, analysts and purchasing managers.

Click on the image for better view
The “business activities” sub-index was reported at 43.4, the second lowest in 46 months. Continued electricity outages as well as non-allocation of foreign currency to supply of raw materials are viewed as the main deterrents to business activities in the month under review.
The “new orders” sub-index (46.9) declined for a fourth month in a row. The domestic orders were largely affected by shortages in liquidity on the demand side. A drop in foreign demand can also be attributed to limitations in border exchanges during Arbaeen rituals with Iraq which is a main destination for Iranian industrial products.
The “employment” sub-index also registered its lowest in 45 months to settle at 47.7. On the one hand, due to the imbalance between the wages and the rising living costs, the workforce does not have enough motivation to stay at work and on the other hand, power outages, non-allocation of foreign currency to imports of raw materials and falling demand have led to decline in production, prompting the companies to pursue job cuts.
The “price of goods and services” sub-index (58.1) posted its biggest in eight months. Although the increases have not yet been put into action for concerns about a recession in demand, they have been largely driven by increases in the forex rates over the past months and non-allocation of currency.
The “sales of goods and services” sub-index (46.9) declined for the fourth consecutive month. Continued reduction of domestic demand driven by a shortage in liquidity, alongside falling demand for Iranian exports appear to be among the main reasons for the drop in sales.
|
INDEX
|
Khordad1403 (May-June2024)
|
Tir1403 (June-July2024)
|
Mordad1403 (July-August2024)
|
|
PMI (seasonally adjusted)
|
44.9
|
47.6
|
47.4
|
|
business activities
|
40.7
|
45.2
|
43.4
|
|
new orders
|
42.1
|
44.3
|
46.9
|
|
suppliers’ delivery time
|
49.5
|
52.8
|
52.2
|
|
raw material inventory
|
45.6
|
49.7
|
50.8
|
|
employment
|
50.5
|
48.9
|
47.7
|
|
raw materials price
|
65.3
|
69.0
|
70.5
|
|
finished goods inventory
|
46.2
|
54.1
|
50.6
|
|
exports of goods and services
|
43.2
|
48.7
|
46.8
|
|
price of goods and services
|
52.9
|
55.3
|
58.1
|
|
consumption of energy carriers
|
51.1
|
56.1
|
52.3
|
|
sales of goods and services
|
43.7
|
48.9
|
46.9
|
|
expectations for next month economic activities
|
59.1
|
59.3
|
60.3
|