Iran’s monthly PMI has experienced a third decline in a row which happened despite expectations for an uptick in demand ahead of the country’s New Year holidays.
Iran Chamber of Commerce, Industries, Mines, and Agriculture (ICCIMA) released the country’s new PMI data for the fiscal month of Bahman (January 20 – February 18, 2025), reflecting a fall in major sub-indexes.
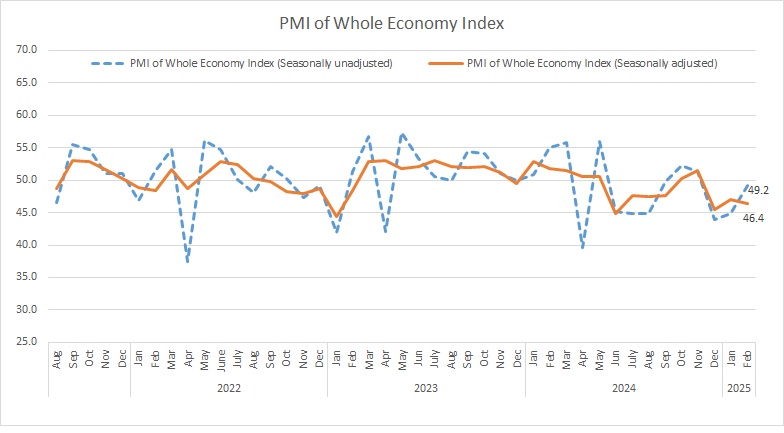
The seasonally adjusted PMI was reported at 46.4, below the 50 mark that separates growth from contraction. The figure stood at 49.2 before the application of seasonal adjustment.
Seasonal adjustment, or deseasonalization, is a statistical method used to remove the seasonal component from a time series, allowing for the independent analysis of trends and cyclical deviations. After preparing dozens of PMI (Purchasing Managers' Index) reports, the Research Center of Iran Chamber of Commerce, Industries, Mines, and Agriculture has now identified the seasonal components of these time series and prioritized seasonal adjustment in its monthly PMI reports.
The PMI reading of this month has dropped with a sharper slope compared to that of the preceding month, driven by persisting energy shortages, increasing foreign exchange rates and rising output prices which has caused the production units to produce at levels lower than their actual capacity.
The Statistics and Economic Analysis Center of Iran Chamber of Commerce, Industries, Mines and Agriculture, the sponsor and coordinator of the survey, announces the whole economy PMI data in a report every month.
The headline PMI is a number from 0 to 100, such that over 50 shows an expansion of the economy when compared with the previous month. A PMI reading under 50 indicates contraction and a reading of 50 implies no change.
PMI is an index of the prevailing direction of economic trends, aiming to provide information about business conditions to company directors, analysts and purchasing managers.
Click on the image for better view
The “business activities” sub-index (46.2) has declined from 47.2 reported in the preceding month. Power and gas outages have interrupted the production process. In addition, concerns about shrinking foreign exchange revenues due to intensified sanctions, rising forex rates, as well as fluctuations in the forex market have slowed the activities of many businesses.
Rising import costs for raw materials have led to an increase in production costs, ultimately driving up the final prices of commodities. This has caused the “new order” sub-index to drop to 42.1, despite expectations of improved demand ahead of the country’s New Year holidays.
The “exports of goods and services” was also reported under the threshold (under 50). The fall was mainly driven by sharp increases in the foreign exchange rate, energy shortages, as well as overnight regulations which have had a significant impact on the decline in exports of goods and services.
According to the new PMI reading, the “raw materials price” sub-index has registered its highest in 22 months.
|
INDEX
|
Azar1403 (Nov-Dec2024)
|
Dey1403 (Dec2024-Jan2025)
|
Bahman1403 (Jan-Feb2025)
|
|
PMI (seasonally adjusted)
|
45.5
|
47.0
|
46.4
|
|
business activities
|
46.2
|
47.4
|
46.2
|
|
new orders
|
41.8
|
46.7
|
42.1
|
|
suppliers’ delivery time
|
48.8
|
51.8
|
48.6
|
|
raw material inventory
|
45.5
|
46.9
|
47.6
|
|
employment
|
47.8
|
43.2
|
51.0
|
|
raw materials price
|
83.9
|
82.0
|
84.4
|
|
finished goods inventory
|
43.0
|
46.8
|
45.0
|
|
exports of goods and services
|
46.4
|
47.0
|
47.6
|
|
price of goods and services
|
61.5
|
58.2
|
68.7
|
|
consumption of energy carriers
|
43.4
|
51.4
|
52.8
|
|
sales of goods and services
|
47.6
|
49.2
|
46.2
|
|
expectations for next month economic activities
|
47.7
|
53.7
|
49.2
|