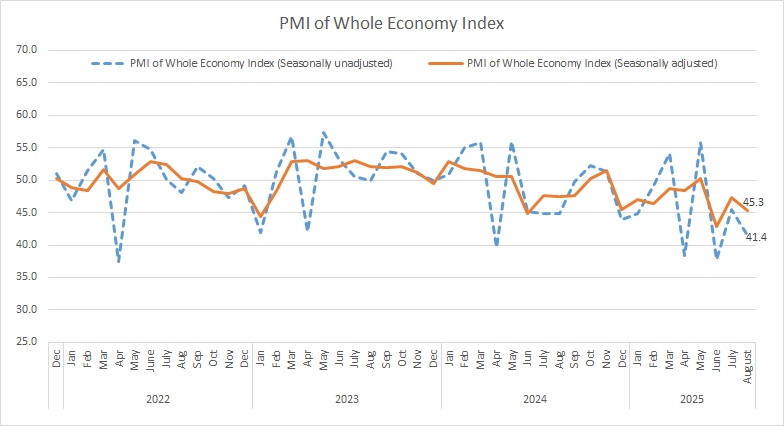
Iran Chamber of Commerce, Industries, Mines, and Agriculture (ICCIMA) has released the country’s new Purchasing Managers’ Index (PMI) data for the fiscal month of Mordad (July 23 – August 22, 2025), showing a sharper contraction across the economy.
The seasonally adjusted headline PMI fell to 45.3, marking the 17th consecutive month of decline and signaling a steeper deterioration compared with last month.
Seasonal adjustment, or deseasonalization, is a statistical method used to remove the seasonal component from a time series, allowing for the independent analysis of trends and cyclical deviations. After preparing dozens of PMI (Purchasing Managers' Index) reports, the Research Center of Iran Chamber of Commerce, Industries, Mines, and Agriculture has now identified the seasonal components of these time series and prioritized seasonal adjustment in its monthly PMI reports.
The Statistics and Economic Analysis Center of Iran Chamber of Commerce, Industries, Mines and Agriculture, the sponsor and coordinator of the survey, announces the whole economy PMI data in a report every month.
The headline PMI is a number from 0 to 100, such that over 50 shows an expansion of the economy when compared with the previous month. A PMI reading under 50 indicates contraction and a reading of 50 implies no change.
PMI is an index of the prevailing direction of economic trends, aiming to provide information about business conditions to company directors, analysts and purchasing managers.
Click on the image for better view
Output in both manufacturing and services remained under pressure, with the “business activities” sub-index dropping to 44.0 – the weakest reading in 58 months, since November 2020. The survey noted that companies faced mounting production constraints, leaving output well below the neutral 50 threshold for the 17th month in a row.
The downturn was attributed to a combination of power shortages, higher input costs, and fragile demand. Many industrial firms reported severe disruptions from electricity rationing, with some facing blackouts up to three days a week and losing half of their productive hours. Rising raw material prices prevented companies from securing adequate supplies, while many firms were unable to obtain foreign currency for importing essential inputs or equipment. Some suppliers, citing unstable market conditions and cost volatility, either withheld sales altogether or restricted supply.
Inventories of raw materials and purchased goods continued to shrink for the 12th straight month, recording a similar pace of decline as in July. New orders extended their downward trajectory for the 18th month in a row, with the contraction accelerating compared to the previous period. Survey respondents pointed to weak consumer purchasing power, persistent inflation, and heightened economic uncertainty, which have led households to cut back on spending.
Employment also decreased in Mordad, marking the fourth decline since the start of the fiscal year. However, the pace of job losses eased slightly compared with the previous month. By contrast, exports of goods and services remained on a downward path for the 16th consecutive month, with a sharper drop than in July, as many companies cited restrictions from sanctions or domestic policies that prevented them from selling abroad.
Business confidence weakened further, with the “expectations for future activity” index hitting its lowest level in 39 months, since June 2022. Rising raw material costs added additional pressure, with the “raw materials price” sub-index climbing from the previous month.
|
INDEX
|
Khordad1404 (May-June2025)
|
Tir1404 (June-July2025)
|
Mordad1404 (July-Aug2025)
|
|
PMI (seasonally adjusted)
|
42.9
|
47.3
|
45.3
|
|
business activities
|
45.5
|
48.4
|
44.0
|
|
new orders
|
38.5
|
46.1
|
42.3
|
|
suppliers’ delivery time
|
45.6
|
49.8
|
48.5
|
|
raw material inventory
|
46.0
|
45.4
|
45.1
|
|
employment
|
43.0
|
46.6
|
49.2
|
|
raw materials price
|
77.3
|
75.9
|
76.3
|
|
finished goods inventory
|
48.5
|
50.9
|
52.4
|
|
exports of goods and services
|
44.3
|
45.6
|
42.8
|
|
price of goods and services
|
59.9
|
56.7
|
54.6
|
|
consumption of energy carriers
|
43.7
|
48.6
|
45.2
|
|
sales of goods and services
|
43.2
|
50.8
|
48.1
|
|
expectations for future activity
|
53.8
|
49.6
|
46.5
|