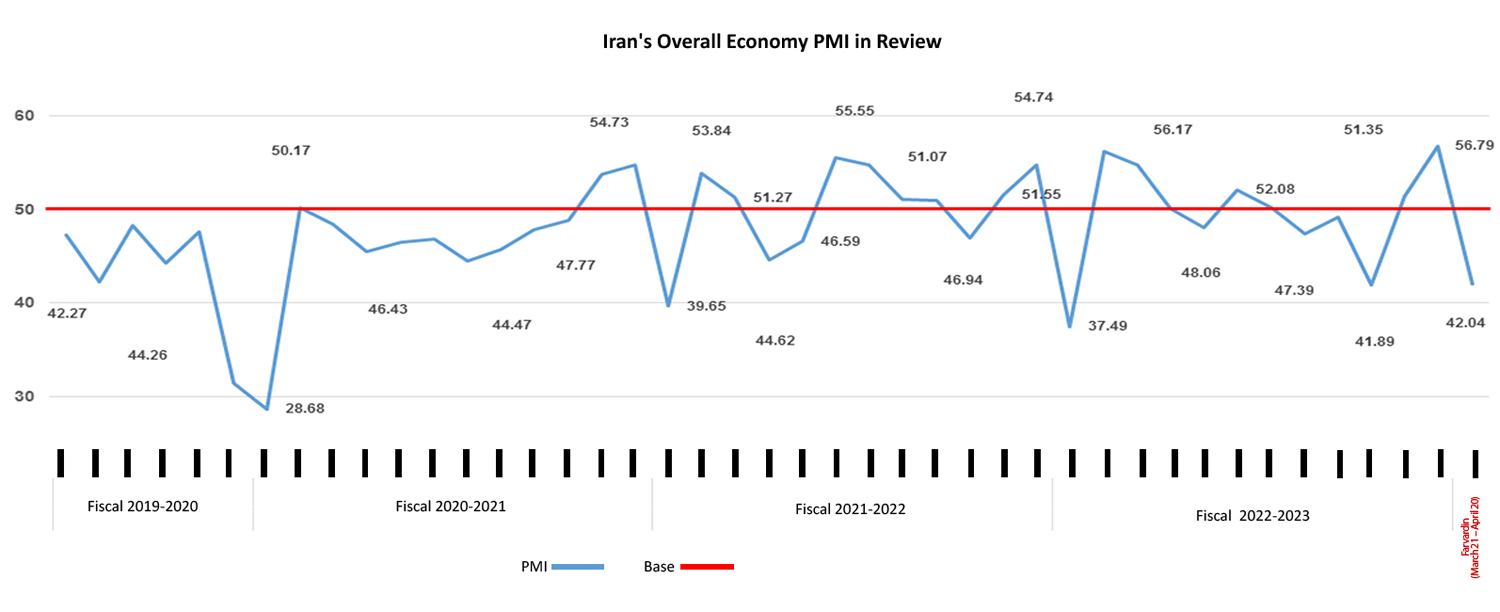
Iran Chamber of Commerce has released the country’s new PMI data for the fiscal month of Farvardin (March 21 – April 20) which is much lower than that of the preceding month.
According to the new PMI reading, Iran’s monthly PMI stood at 42.04 to register one of its lowest.
The decline was largely as a result of the two-week holidays in the beginning of the Persian New Year.
All the main sub-indexes, except for “suppliers’ delivery time” and “employment” were reported below the threshold (below 50) in the new PMI reading.
The Statistics and Economic Analysis Center of Iran Chamber of Commerce, Industries, Mines and Agriculture, the sponsor and coordinator of the survey, announces the whole economy PMI data in a report every month.
The headline PMI is a number from 0 to 100, such that over 50 shows an expansion of the economy when compared with the previous month. A PMI reading under 50 indicates contraction and a reading of 50 implies no change.
PMI is an index of the prevailing direction of economic trends, aiming to provide information about business conditions to company directors, analysts and purchasing managers.

Click on the image for better view
The “business activities” sub-index (34.60) fell in Farvardin as it does every year in this month to register a one-year low.
The “exports of goods and services” (40.53) sub-index also registered one of its lowest during the 43-month survey.
The “expectations for next month economic activities” sub-index registered a record high of 75.76 during the 43-month survey which is indicative of positive expectations for the next month.
The “new orders” sub-index (37.65) posted a dramatic decline from 54.97 of the preceding month.
The “suppliers’ delivery time” sub-index dropped from last month’s 61.48. It however remained above the threshold at 50.03.
|
INDEX
|
Bahman1401
(Jan-Feb2023)
|
Esfand1401
(Feb-Mar2023)
|
Farvardin1401
(Mar-Apr2023)
|
|
PMI
|
51.35
|
56.79
|
42.04
|
|
business activities
|
53.45
|
60.81
|
34.60
|
|
new orders
|
49.60
|
54.97
|
37.65
|
|
suppliers’ delivery time
|
57.72
|
61.48
|
50.03
|
|
raw material inventory
|
42.20
|
54.14
|
43.14
|
|
employment
|
51.14
|
52.28
|
51.37
|
|
raw materials price
|
86.49
|
87.61
|
86.56
|
|
finished goods inventory
|
47.93
|
45.18
|
45.58
|
|
exports of goods and services
|
44.54
|
48.81
|
40.53
|
|
price of goods and services
|
61.84
|
69.94
|
71.44
|
|
consumption of energy carriers
|
59.62
|
54.02
|
34.30
|
|
sales of goods and services
|
57.21
|
61.18
|
34.69
|
|
expectations for next month economic activities
|
55.97
|
36.48
|
75.76
|